

Creating a Curious Machine
Can AI perform exploratory data analysis at scale?
"Curiouser and curiouser!" says Alice as she goes deeper into the rabbit hole.
When encountering a talking rabbit with a waistcoat, there are two kinds of people: 1) the type that wants to get the hell away from this weirdness, and 2) those who cannot stop themselves from knowing more by digging in. Alice was the second type of person, so we get a story.
Any good analyst isn’t that different. They enjoy pursuing the small evidence of something odd, weird, or interesting to unravel more.
Most modern business intelligence has moved from supporting exploratory curiosity to efficient systems that can brute-force metrics. We’ve harped (maybe more than necessary) enough on why most dashboards today aren’t cutting it. They respond to the known questions and miss the weird and the anomalous.
Exploratory data analysis feels like an art, and it has no place in a scaling organization that is heavily metric-driven (so goes the hypothesis). All this means that, in general, we are losing the space and sometimes the ability to notice interesting insights.
We’ve automated everything except the most joyful analysis: when you stumble upon something unexpected and say, “Wait, what?”
Anscombe’s Quartet
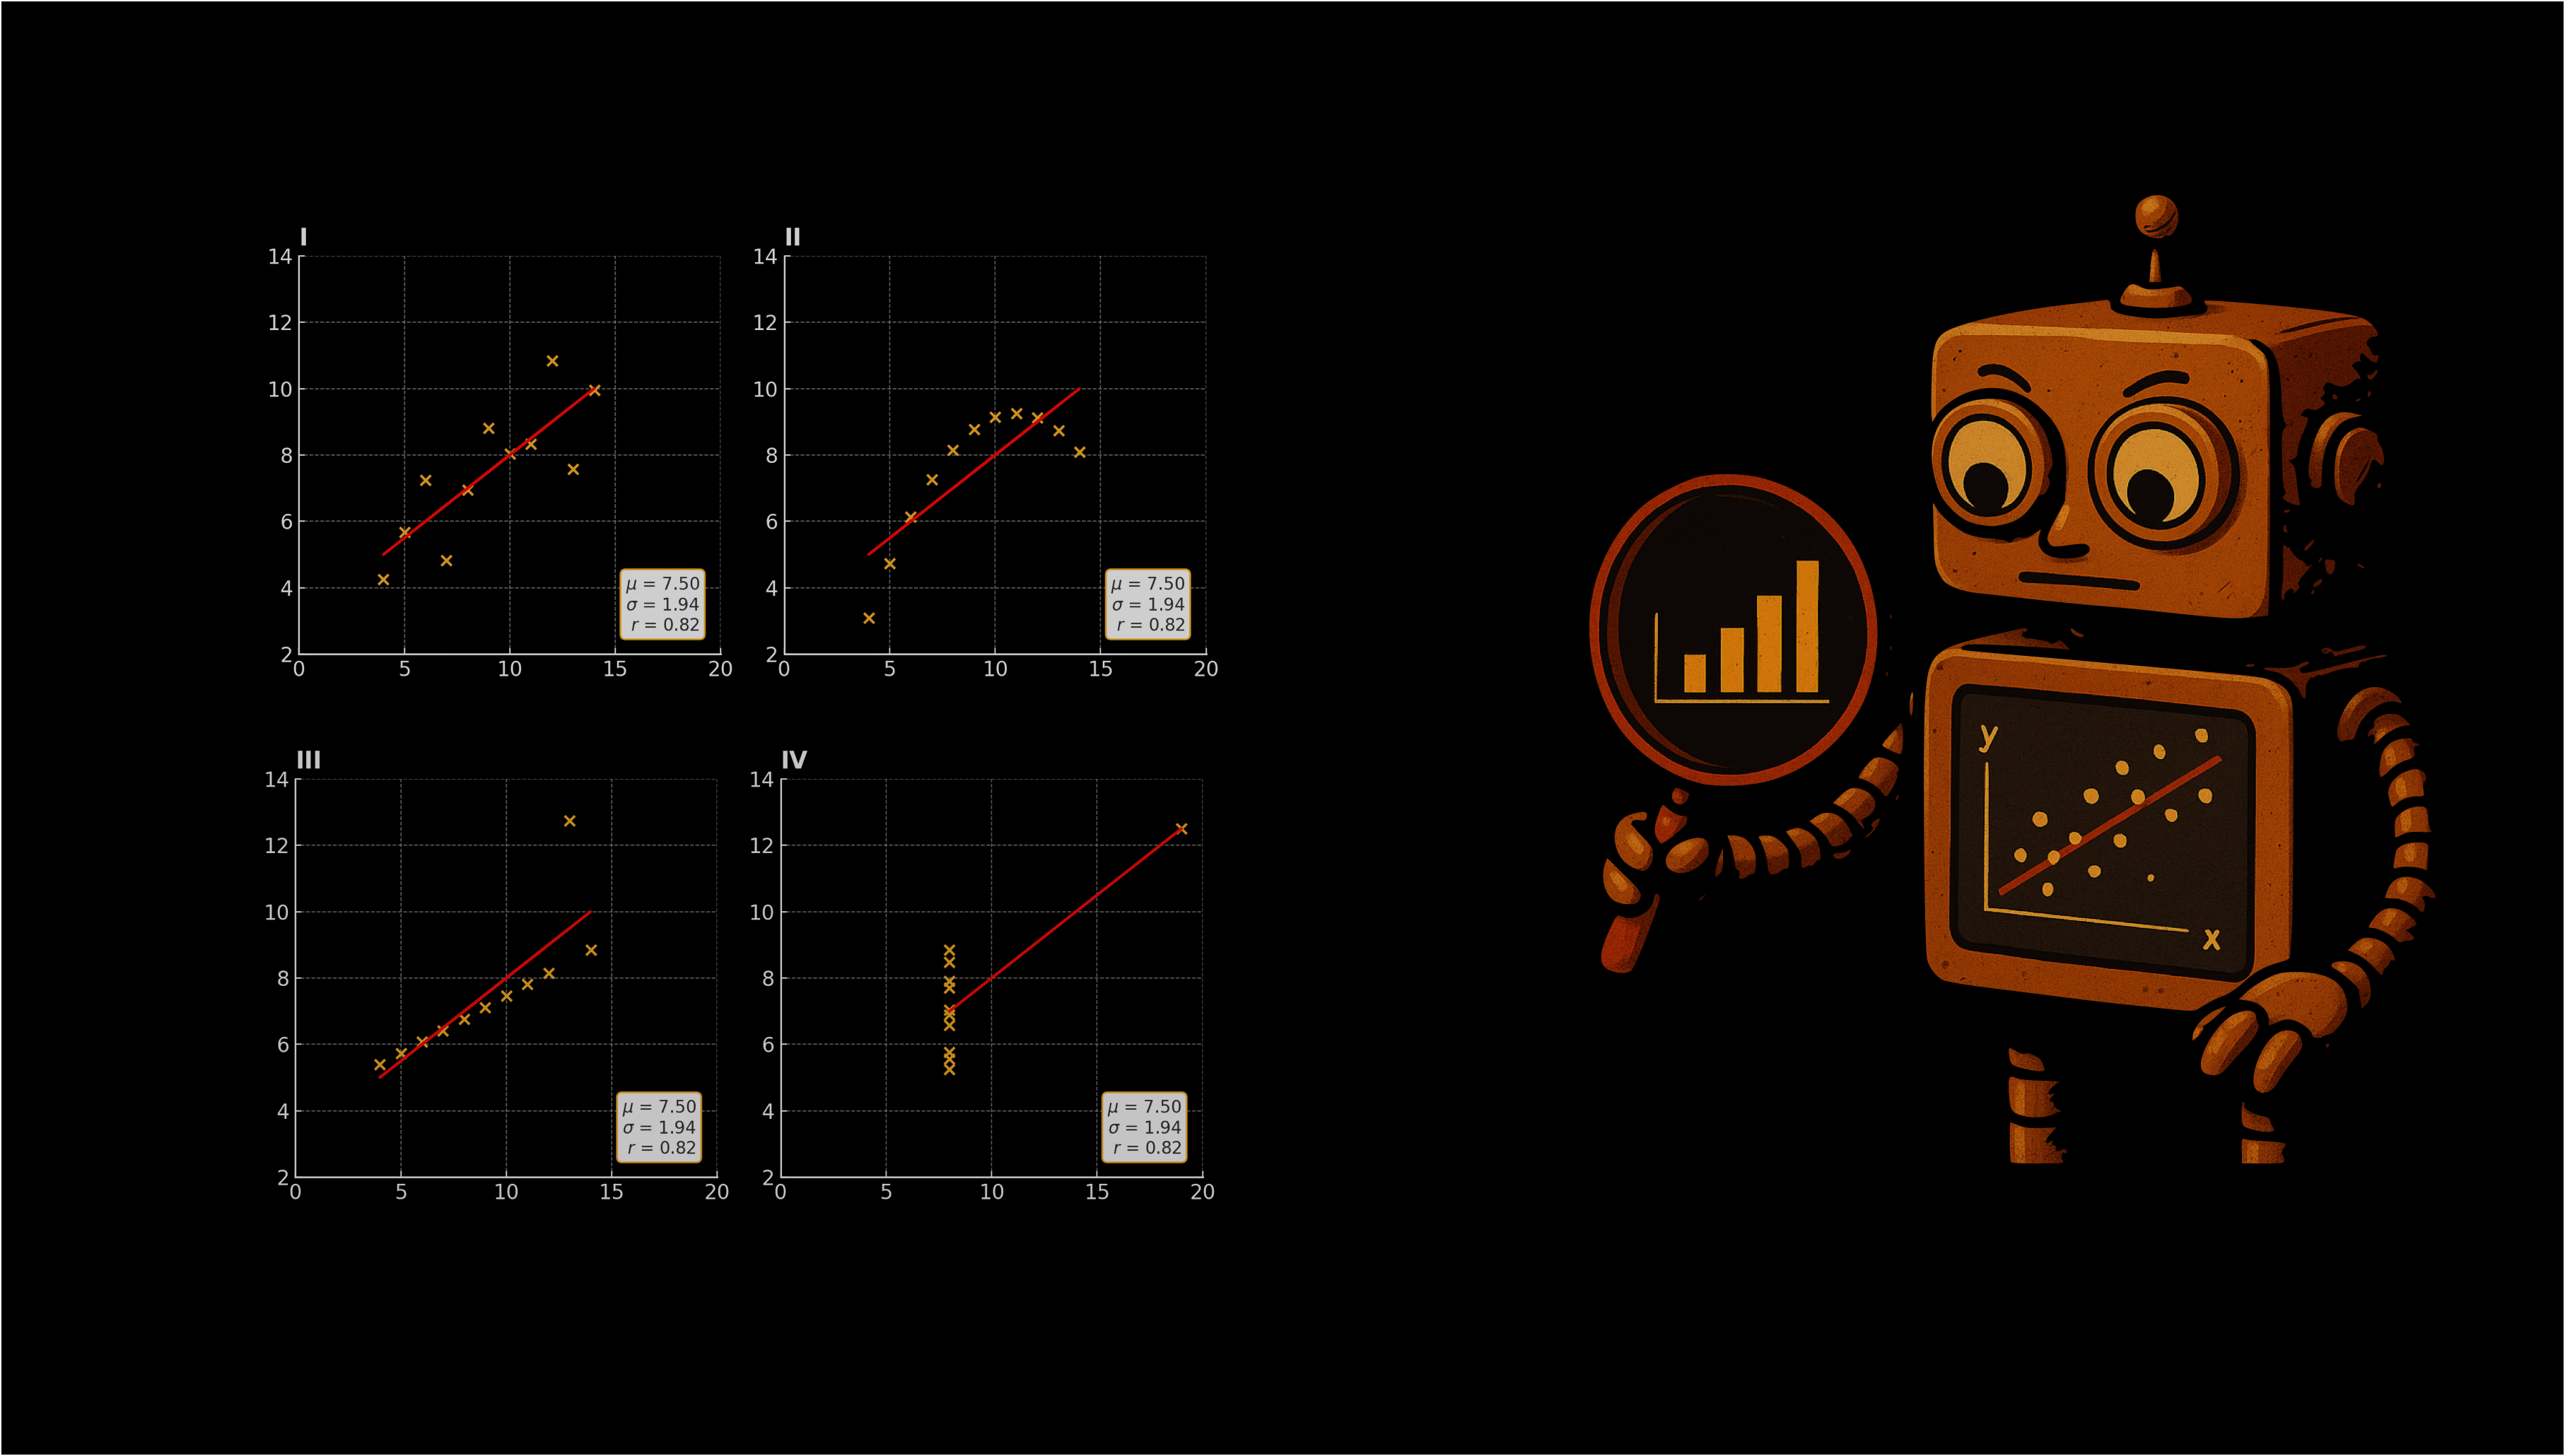
If you haven’t heard of it before, Anscombe's Quartet is a group of 4 data sets that have the exact same mean, standard deviation, and even the regression slope. However, when they are plotted and you visually inspect the plots, they are qualitatively different.
Here’s a visual example from matplotlib:

Looking at a data set visually has value. Mere statistical aggregates aren’t always going to tell you the story. Imagine if the above points represent customer behavior, and you are a product manager looking at the charts. You will have a much different interpretation of each of these.
However, as the volume of data and analysis increases, as tools occupy all the space of presenting aggregated information, the time and effort spent on exploratory data parsing is lower than ever.
Data exploration loop
Most exploratory analyses follow the following pattern:
Glance: Look at the ugly, unfiltered raw data. Unlike a polished dashboard, you are not looking for answers. You’re looking for….vibes. (You sense when something is off with the data you’re looking at.)
Poke: Form a micro-hypothesis: “Why is bounce rate only high for iOS 16.4 users in Delhi?”
Zoom: Cut the data, test the theory, and run comparisons. Then decide if it’s noise or insight.
Unfortunately, most modern tools and insight platforms have removed the ability to glance and poke and have solved for the zoom. You get the cuts, slices, and synthesized KPIs fed non-stop. Nine out of ten times, they are in a holding pattern, following the trend they are supposed to follow.
But what about all the questions you never knew to ask?
What’s a curious machine?
We’ve been asking this question at Babbage as a core part of what we’ve been building:
Can a system "glance" at data, form a hypothesis, and dig deeper?
We are not talking anomalies or data issues here, but genuine curiosity.
Imagine you are running a business function and you hire a nosy analyst on your team. You give her unlimited resources and access and tell her that her only job is to keep curiously looking at all the data and surfacing insights for you. In the real world, this is limited by cost, ability, and the speed at which curiosity can be scaled. But now, with AI, it can be.
Imagine getting a message each morning:
"Revenue is stable, but CAC spiked 23% only for the cohort you acquired last month. The spike is linked to an ad copy change on Meta campaigns. Want to explore?"
That’s a curious machine. It’s like an AI-powered analyst that doesn't wait for instructions but proactively explores data, identifies anomalies, and surfaces unexpected patterns like an autonomous explorer of your datasets. It’s isn’t mere anomaly detection either because the machine seeks to find the story behind the anomaly. It’s not merely ‘what went wrong’ but ‘what might be changing.’ It’s surfacing signals you didn’t know you had to look for.
Exploratory Analysis on steroids
Exploratory data analysis has always relied on human curiosity. However, human curiosity is expensive (especially in a fast-moving/high-performing company). There’s only so much slicing and dicing an analyst bombarded by multiple teams can do before burning out. As managers chase KPI, they ignore the weird stuff.
Traditionally, business intelligence has continued to solve for the supply side of analytics. Dashboarding and easier querying have tried to bridge the gap, but have only managed to make the supply a little bit more easier to consume.
It has been hard to code curiosity or brute force using a machine. But now, with AI, we may have reached a point where it is possible to have a curious machine.
We predict that in a few years, instead of posing a specific question to a tool like ‘What happened with our sales last month?’, you may be asking ‘What do you think is interesting today for me to know?’.
At Babbage, we are building for this.
Let the machine aggregate meaning.
Let humans do what gives true leverage: decision-making.
~Babbage Insight